Unity doesn't have a built in ColorPicker utility, but anyone can learn to make one themselves. This guide will help you create an interactive HSV Color Picker for the Universal Rendering Pipeline that dynamically changes with user input.
History of Color
Once upon a time, in about the year 1800, a guy named Thomas Young theorized that human eyes have 3 different kinds of color receptors, each sensitive to a different spectrum of visible light waves.[1][2] This upset just about everyone at the time because a couple of popular guys a century earlier named René Descartes and Sir Isaac Newton told everyone that light was made up of a bunch of tiny particles they called "corpuscles" moving incredibly fast in straight lines. Isaac even wrote a book about it called Opticks[3] which became something of a public mania. One of Isaac's friends, a guy named Christiaan Huygens thought Isaac was wrong and wrote a and book[4] about it though. But Christiaan wasn't a popular kid like Isaac so his idea about light waves was basically ignored until Thomas came along 100 years after Christiaan died and told everyone that Isaac was wrong and Christiaan had been right the whole time. It was a whole thing. Anyways.
Eventually Thomas Young became the new popular guy, and after he died a guy named Charles Babbage invented a thing called the ophthalmoscope[5] and gave it to his friend Thomas Wharton Jones who didn't care.[6] Actually, no one cared about it until another guy named Hermann Ludwig Ferdinand von Helmholtz invented another ophthalmoscope four years later.[7] In fact, people cared so much that he became a celebrity and now half of the scientific research centers in Germany are named after him.[8] It turns out there's a lot of drama about color, yeesh. Anyways, after Hermann started using his ophthalmoscope to look into people's eyes he basically agreed with Thomas and he wrote a book[9] about it which a lot of people liked. After Hermann died a guy named Gunnar Svaetichin looked at a bunch of fish retinas[10] and said,
Yep, that all checks out.[citation needed]
Because of all of this color drama other people got really invested in the whole color thing too. One guy named James Clerk Maxwell really liked Thomas Young and he came up with a way to use Thomas and Isaac's ideas to create color photographs and in the process he basically invented a whole new science himself he called Colour Vision[11][12][13] after theorizing about what caused Colour-Blindness.[14][15] These days we call Maxwell's science 'Colorimetry' because it needed a cool sciency sounding name.
After all of these people died this Colorimetry thing became really popular because these new things called "televisions" and "computers" were becoming a real hot commodity and manufacturers needed a way to standardize the viewing experience on their screens. In 1996 a few peoople from two companies named Microsoft and Hewlett-Packard finally took standardizing color on CRT[16] screens seriously enough to create the first widely adopted industry color standard called sRGB[17] based on James' color model. But a company called Adobe didn't think sRGB was good enough so they made their own standard called Adobe RGB[18] two years later. These days a group called the International Color Consortium[19] decides the standard colorspace we all use but unfortunately for artists and filmmakers everywhere, every screen still displays colors differently to this day.
RGB vs HSV Colorspace
So because those guys at Microsoft and Hewlett-Packard used James Clerk Maxwell's color model, basically these days everyone is using some form of RGB Colorspace when it comes to putting colors on screens. But what does that mean? For our purposes today it means that people smarter than us have decided that color gets to be represented by literal 3D space and it looks like this:
Think of RGB color as a 3 dimensional cube with 3 axes: Red, Green, and Blue. if you're programming or animating these axes might also be called X, Y, and Z. Depending on which software you're using the directions of these axes may change, but think of (R,G,B) as just another way of saying (X,Y,Z).
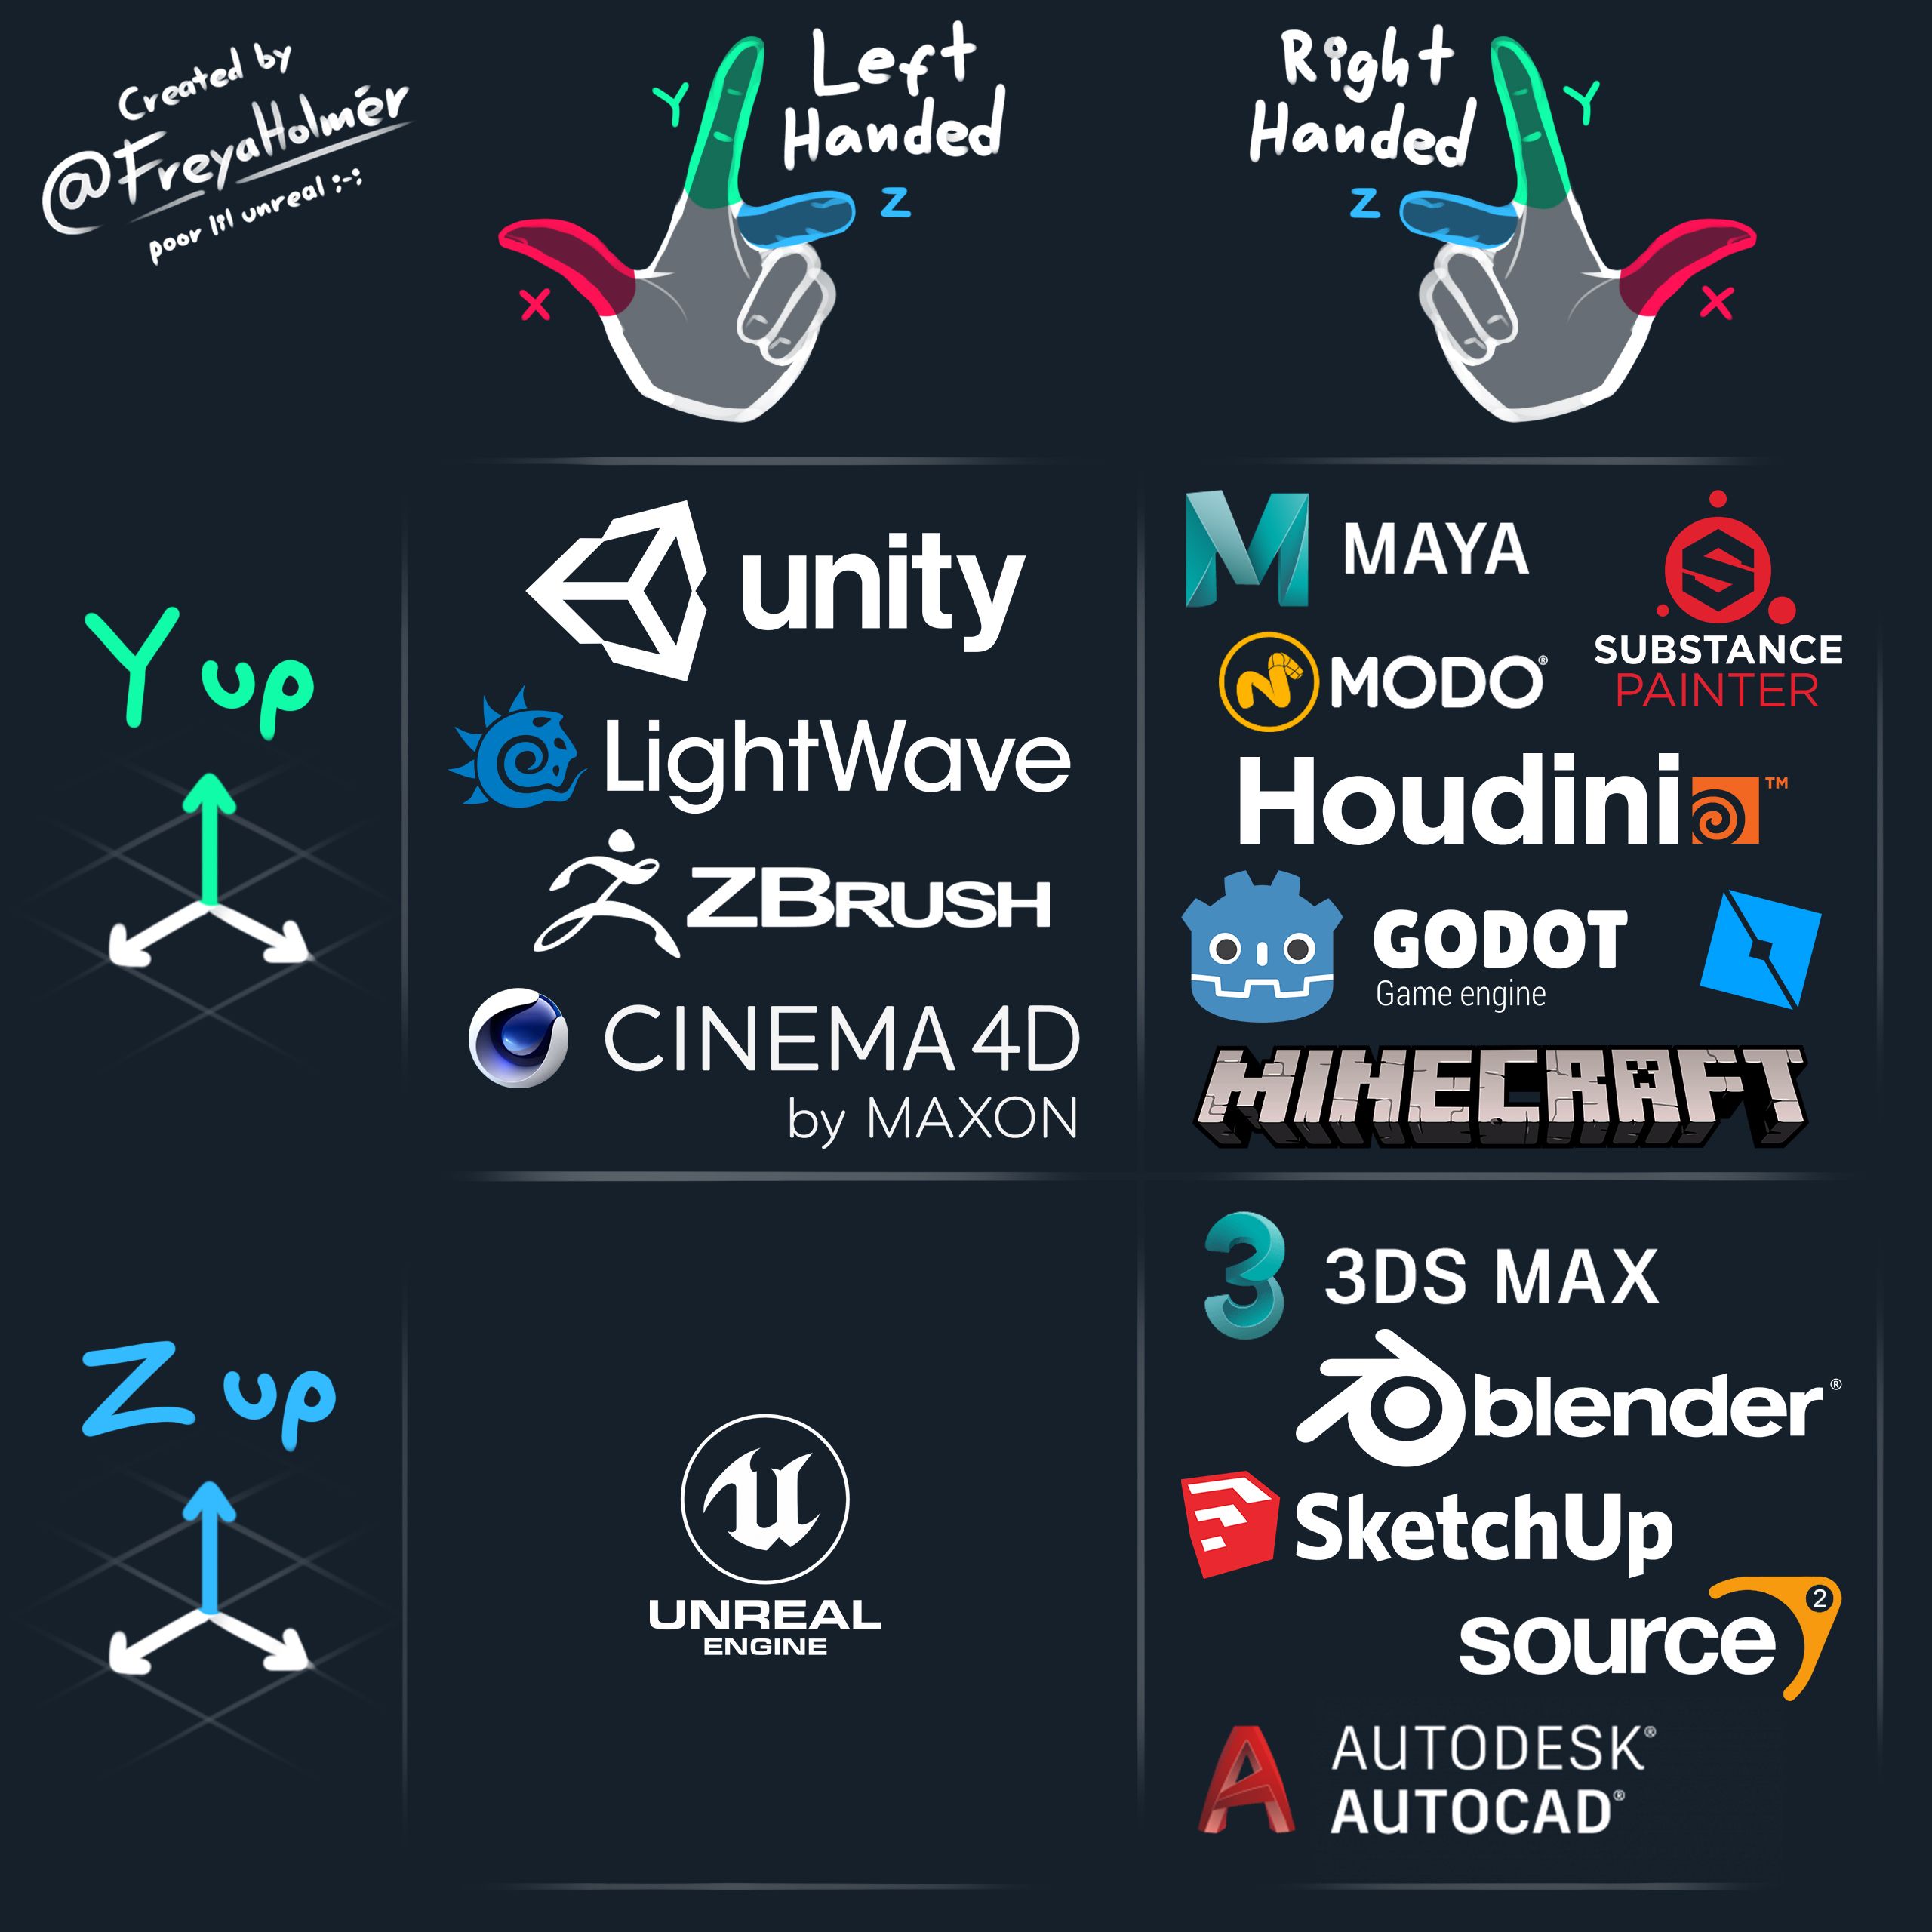
The way we've arranged these colors is with the Z axis pointed up (Blue is on top of the cube) with a Left Handed Coordinate system (the Red or X axis is represented by our left thumb when we assign our index finger to the Z axis) which means you're currently looking at the Unreal Engine's Coordinate System in RGB Colorspace! if you're still thoroughly confused, let's plot out the maximum and minimum color values at each of the 8 vertices on our colorspace cube:
As you can see, adding Blue (0,0,1) and Red (1,0,0) gives us Magenta (1,0,1). Similarly, adding
Green (0,1,0) and Blue (0,0,1) gives us Cyan (0,1,1). When all of the values are at their maxima we end up with White (1,1,1)
and when there's a complete absense of color we end up with Black (0,0,0).
Well, if that didn't make any sense to you one of the more interesting (and perhaps slightly more visually intuitive) ways of arranging colors is
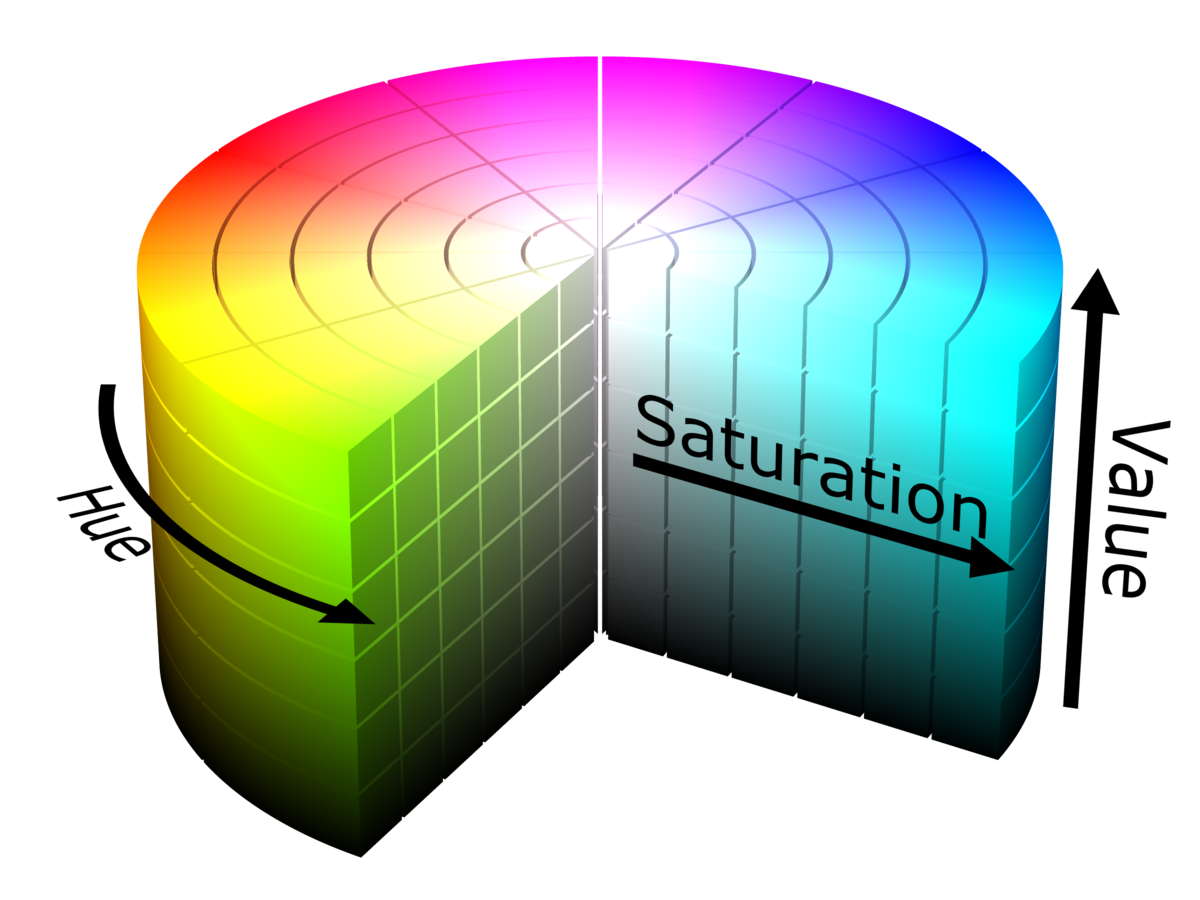
a system of mapping RGB Colorspace called Hue, Saturation, Value
or HSV which changes that formula up a bit by arranging colors on a cylander instead of a cube.
The distance from the middle of our cylander is the 'Saturation' value, which determines the strength of the color value on a scale of 0 to 1 with 0 being white and 1 being the full color value of a given hue. The 'Hue' value is determined by the angle around the cylander. How far up on our cylander determines the darkness or 'Value' of the color, with a value of 0 being black at the bottom and 1 at the top being the full color. Occasionally you might encounter 'HSL' or "Hue, Saturation, Lightness" colorspace, which is identical to this scale except that saturation goes from black to full color and then back to white instead of black to the full color value, which on the HSL scale is only half way up on the lightness scale. To be clear, HSV colorspace doesn't create any new colors, it's simply a rotated version of our friendly RGB color cube. If we project every point on our cube to a plane below we can start to see the 'Hue' portion of this colorspace become clear.
[24]This way of re-arranging RGB Colorspace was first proposed at SIGGRAPH in 1978 by Alvy Ray Smith.[25] What's the purpose of doing this? Well, for our purposes today it makes for much more intuitive UI for artists. Various kinds of HSV color pickers have been around since the early 90s and were made popular by editing programs like Adobe Photoshop (1990), Fractal Design Painter (1993), and SGI IRIX 5 (1995) and they remain the most popular form of color pickers to this day for a reason.
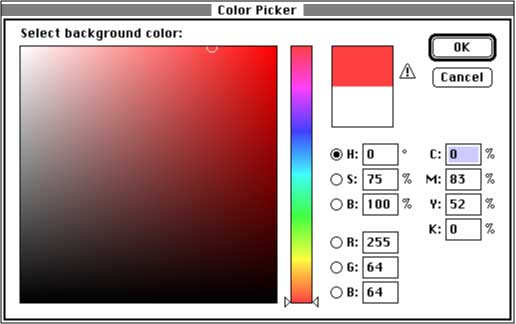
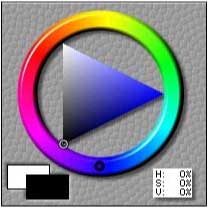
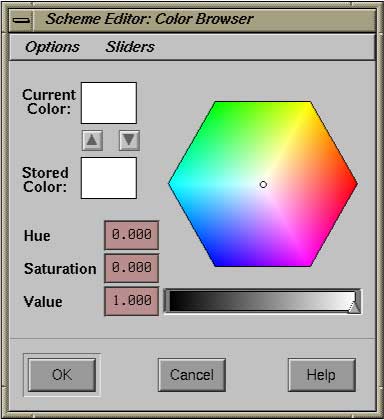
One of my favourite things about HSV colorspace is its relative mathematical simplicity. Calculating the conversion between the spaces is relatively straight forward once you understand how each is constructed and how they relate to eachother. Speaking of constructing HSV colorspace, let's look at one more image before we open up ShaderGraph and start building our color wheel. If you hadn't noticed yet, the Hue portion of our colorwheel is very close to a triangle wave across each color channel that's been clamped between a Value of 0 and 1.
We can use this fact to simplify a lot of the maths that we would otherwise use to construct our outer 'Hue' portion of the color wheel if we went about creating it by transforming RGB Colorspace directly. In order to start constructing our color channels we first have to convert a linear value from 0-1 to turns around our circle (angle). This is neccesary to if we want to make our Hue change based on angle instead of linearly on either the horizontal or vertical axis. So how do we create this angle? Well, it turns out we can create that value by transforming UV space since UVs also go from 0 to 1.
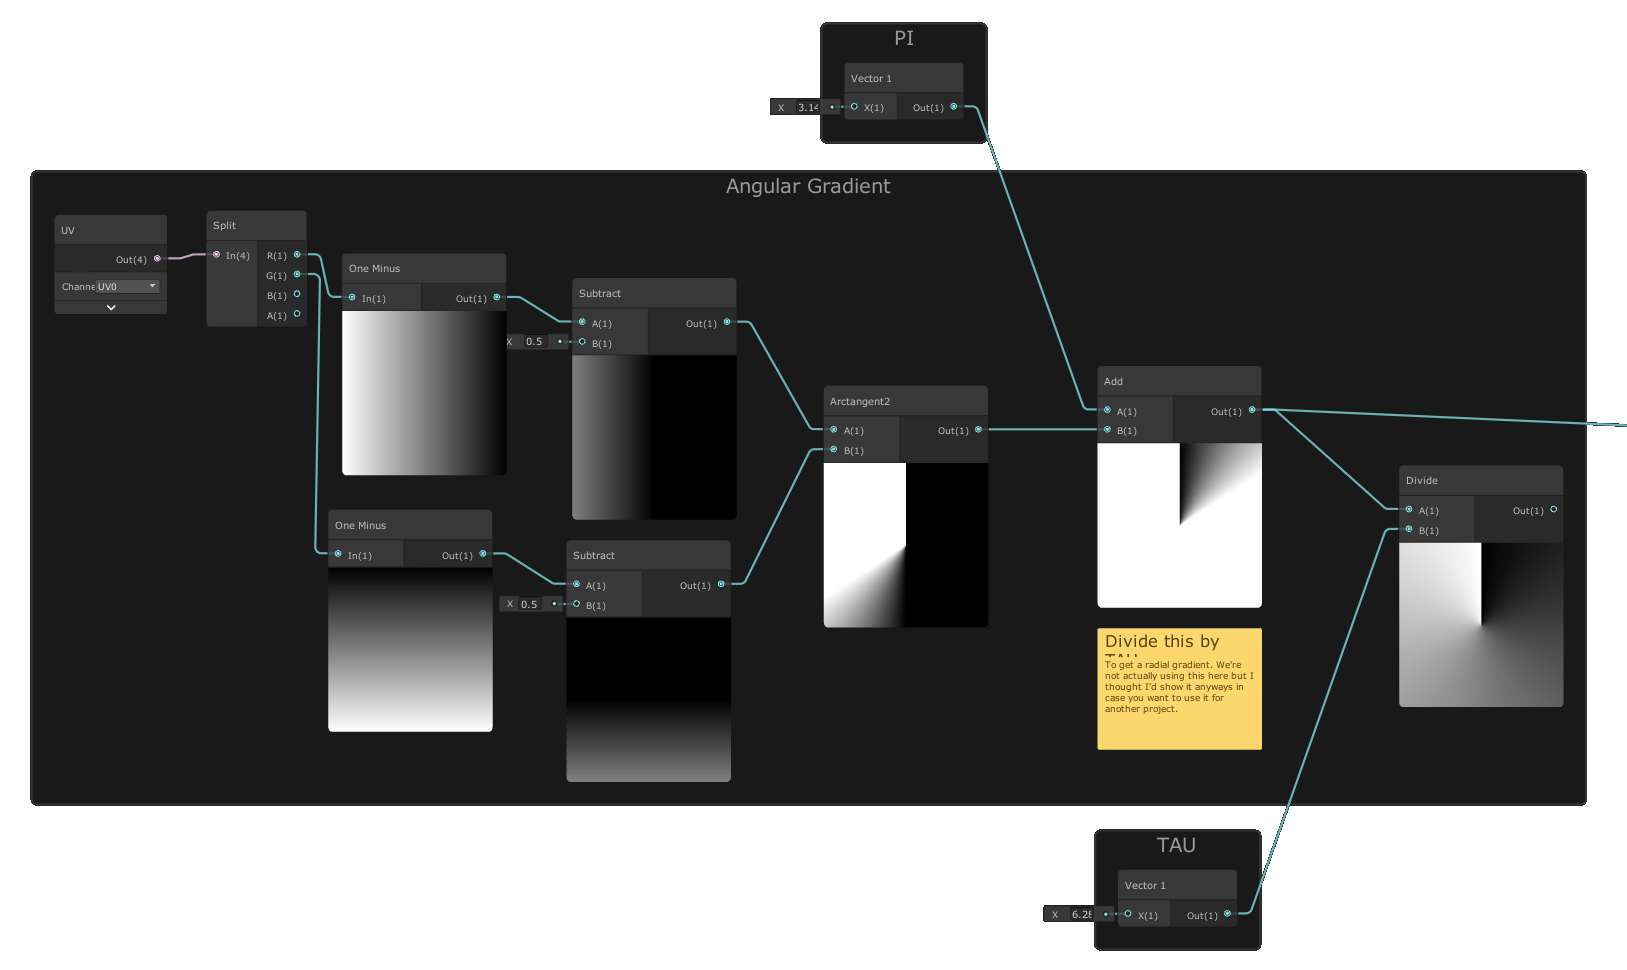
Once we split the X and Y channels of our UVs (remember, 'R' and 'G' are just another way of saying 'X' and 'Y'!) we have a nice gradients from 0-1 on both the vertical and horizontal axes. If we hook both of those into One Minus nodes, it inverts the direction of the gradients which now go from 1-0. By subtracting 0.5 from each we have two gradients that go from 0.5 to 0, and both reach 0 at half way across the gradient. By hooking each of these into an Arctangent2 node we get the arctangent values of both inputs, which effectively has mapped our values onto a circle from -PI to PI. But what we want is a mapping from 0 turns around the cirlce to 1 turn (TAU or 2PI Radians). So let's add PI and... tada! We've got an angle! We can double check our math by dividing our angle by TAU and what we should get as a result is a perfect radial gradient that maps all the way around giving us a value from 0-1 depending on our input angle. I should note before we move to the next step, that we also just completed all of the math neccesary to create a radial progress bar in ShaderGraph! Let's move on to the next step, creating our first Hue channel.
Before we continue in ShaderGraph let's do a quick Trigonometry review. Remember, all we want to do is make a triangle wave, and then we want to clamp it between 0 and 1. The most straight-forward way of creating a triangle wave is the equation
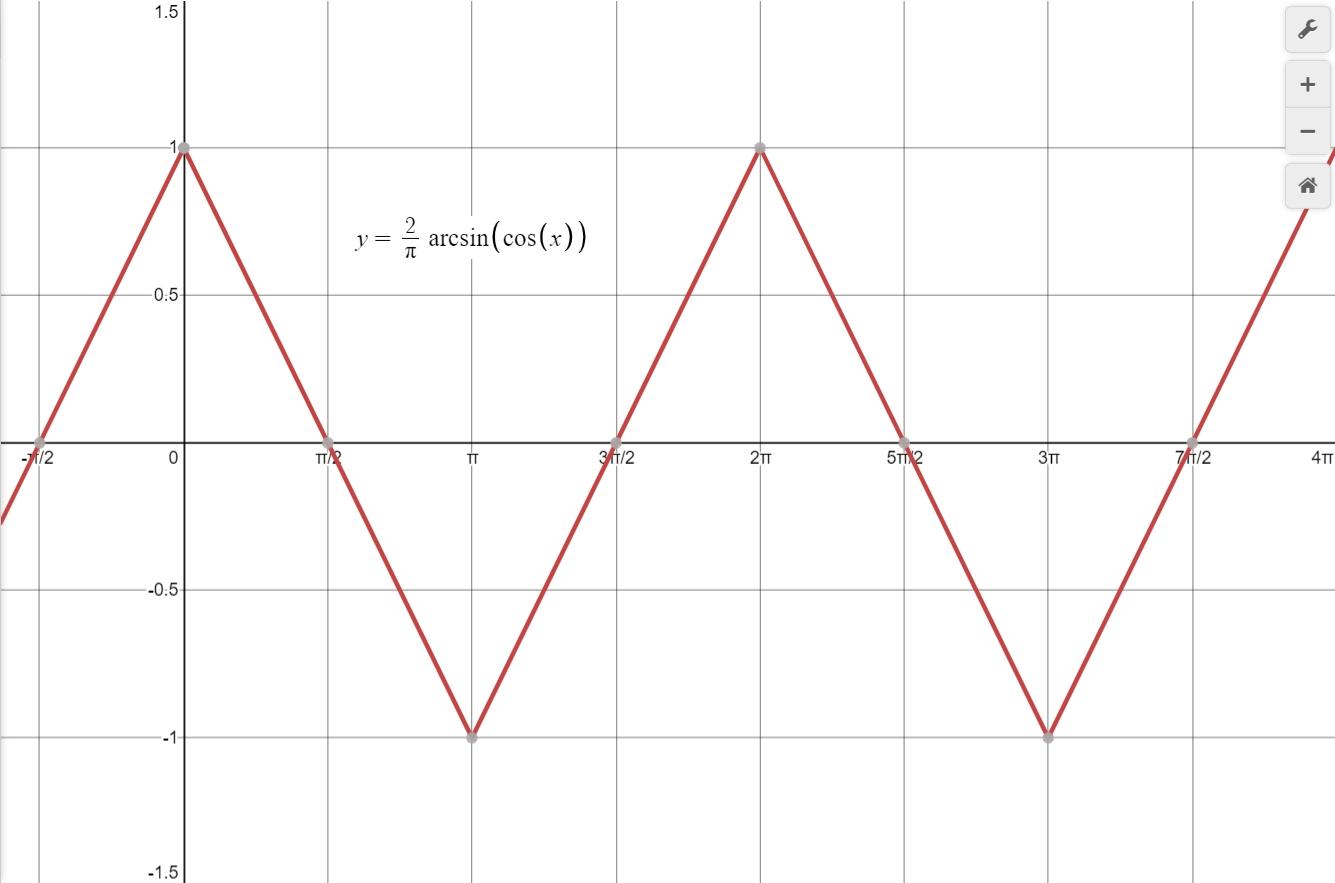
However, what we want to create is a triangle wave with a greater amplitude that 50% of the time is below 0 or 1 so that
once we clamp it between those values it looks like the clamped triangle wave we recognized earlier.
It turns out the original equation for a triangle wave of

If you're starting to think this looks an awful lot like the Red channel we need to construct for our Hue, you probably have an idea of where this is going now. Alright, let's recreate this in ShaderGraph!

By hooking up the output of our Angle that we made earlier to a Cosine and then Arcsine node we've recreated our equation in ShaderGraph. Because ShaderGraph requires an input in order to apply a mathematical transformation we have to first find the cosine of our angle before we can calculate the arcsine of the cosine of the angle. This means that when we're using trigonometric functions in ShaderGraph we have to calculate them in the reverse order we would write them, which can take a little getting used to. You're probably wondering what the rest of the things going on in this graph are now. Well, as I said earlier, if we multiply this triangle wave by 2/PI we get a triangle wave with an amplitude of 1, right? This means that if we then multiply that triangle wave by any value, that value will become the new amplitude of our triangle wave. I find this makes it much more intuitive to get an immediate sense for the amplitude of our wave. And as it turns out, if we set our triangle wave to have an amplitude of 1.5 we have our original wave again, which means the original amplitude of our wave (before setting it to an amplitude of 1 by multiplying the wave by 2/PI) was already 1.5! Because we want our red channel to eventually overlap significantly with our Blue and Green channels, I'm also adding 0.5 to the whole wave, using the Add node and shifting our wave vertically up on the Y axis by 0.5. Finally, because we only want values between 0 and 1 we need to clamp our triangle wave. We could use the Clamp node and set the min value to 0 and the max value to 1, but it turns out that the Saturate node has the same effect without having to fiddle with inputs, so let's use that instead. Tada! We've just finished our 'Red' channel for our Hue space. Feel free to delete the extra two Multiply nodes now since it's clear they cancel each other out and we were merely using them to situate ourselves and get a sense of our triangle wave without getting to see it in the same way we would using a graphing calculator.
References:
- Young, T. (1801). II. The Bakerian Lecture. On the mechanism of the eye. Philosophical Transactions of the Royal Society of London, 91, 23–88. doi:10.1098/rstl.1801.0004
- Young, T. (1802). II. The Bakerian Lecture. On the theory of light and colours. Philosophical Transactions of the Royal Society of London, 92, 12–48. doi:10.1098/rstl.1802.0004
- Newton, I. (1704). Opticks: Or, A treatise of the reflexions, refractions, inflexions and colours of light: Also two treatises of the species and magnitude of curvilinear figures. London: Printed for Sam. Smith, and Benj. Walford.
- Christiaan, H. (2005). Treatise on Light: In which are explained the causes of that which occurs in reflexion, & in refraction and particularly in the strange refraction of Iceland crystal. (Translated by Silvanus P. Thompson, 1912). Project Gutenberg. (Original work published 1690) gutenberg.org/ebooks/14725
- Keeler, C. R. (2004). Babbage the unfortunate. British Journal of Ophthalmology, 88(6), 730–732. doi:10.1136/bjo.2003.018564
- Bynum, W. F. (2004). Jones, Thomas Wharton (1808–1891). Oxford Dictionary of National Biography. doi:10.1093/ref:odnb/37617
- Helmholtz Association. (2021, February 1). In Wikipedia.
- Ravin, J. G. (2017). Hermann von Helmholtz: The Power of Ophthalmoscopy. Foundations of Ophthalmology, 85–93. doi:10.1007/978-3-319-59641-9_8
- Helmholtz, H. (1867). Handbuch der physiologischen Optik. Leipzig.
- Svaetichin G. (1956). Spectral response curves from single cones. Acta physiologica Scandinavica. Supplementum, 39(134), 17–46.
- Maxwell, J. C. (1890). On Colour Vision. The Scientific Papers of James Clerk Maxwell, 267–279. doi:10.1017/cbo9780511710377.022
- Wiveleslie, A. W. de. (1895). Colour vision: being the Tyndall lectures delivered in 1894 at the Royal Institute. S. Low, Marston.
- Hopley, I. (1960). Clerk Maxwell's Experiments on Colour Vision. Science Progress (1933- ), 48(189), 46-66. Retrieved February 22, 2021, from http://www.jstor.org/stable/43424831
- Maxwell, J. C. (1857). XVIII.—Experiments on Colour, as perceived by the Eye, with Remarks on Colour-Blindness. Transactions of the Royal Society of Edinburgh, 21(2), 275–298. doi:10.1017/s0080456800032117
- Maxwell, J. C. (1871). On colour vision. Royal Institution of Great Britain.
- Cathode-ray tube. (2021, February 21). In Wikipedia.
- Stokes, M., Anderson, M., Chandrasekar, S., & Motta, R. (1996, November 5). A Standard Default Color Space for the Internet - sRGB. www.w3.org/Graphics/Color/sRGB.html.
- Adobe. (1998). Adobe RGB (1998) color image encoding. www.adobe.com/digitalimag/adobergb.html.
- International Color Consortium. (2020, August 11). In Wikipedia.
- Horvath, M. (2018, July 19). File:RGBCube a.svg. Wikimedia Commons. commons.wikimedia.org/wiki/File:RGBCube_a.svg.
- Holmér, F. (2020, November 8). here, have a coordinate system chart~. Twitter. twitter.com/freyaholmer/status/1325556229410861056.
- Westland S., Cheung V. (2016). RGB Systems. In: Chen J., Cranton W., Fihn M. (eds) Handbook of Visual Display Technology. Springer, Cham. doi:10.1007/978-3-319-14346-0_12
- Horvath, M. (2009, November 12). File:HSV color solid cylinder.png. Wikimedia Commons. commons.wikimedia.org/wiki/File:HSV_color_solid_cylinder.png.
- Jacob, R. (2010, January 28). File:HSL-HSV hue and chroma.svg. Wikimedia Commons. commons.wikimedia.org/wiki/File:HSL-HSV_hue_and_chroma.svg.
- Smith, A. R. (1978). Color gamut transform pairs. ACM SIGGRAPH Computer Graphics, 12(3). doi:10.1145/965139.807361
- Goffrie. (2006, August 30). File:HSV-RGB-comparison.svg. Wikimedia Commons. commons.wikimedia.org/wiki/File:HSV-RGB-comparison.svg.
